Why Engagement Survey Analysis Is the Most Underused Tool in Your HR Stack
Engagement survey analysis is the process of systematically reviewing, interpreting, and acting on employee survey data to understand how connected, motivated, and committed your workforce truly is — and then using those insights to drive…

Why Engagement Survey Analysis Is the Most Underused Tool in Your HR Stack
Engagement survey analysis is the process of systematically reviewing, interpreting, and acting on employee survey data to understand how connected, motivated, and committed your workforce truly is — and then using those insights to drive real change.
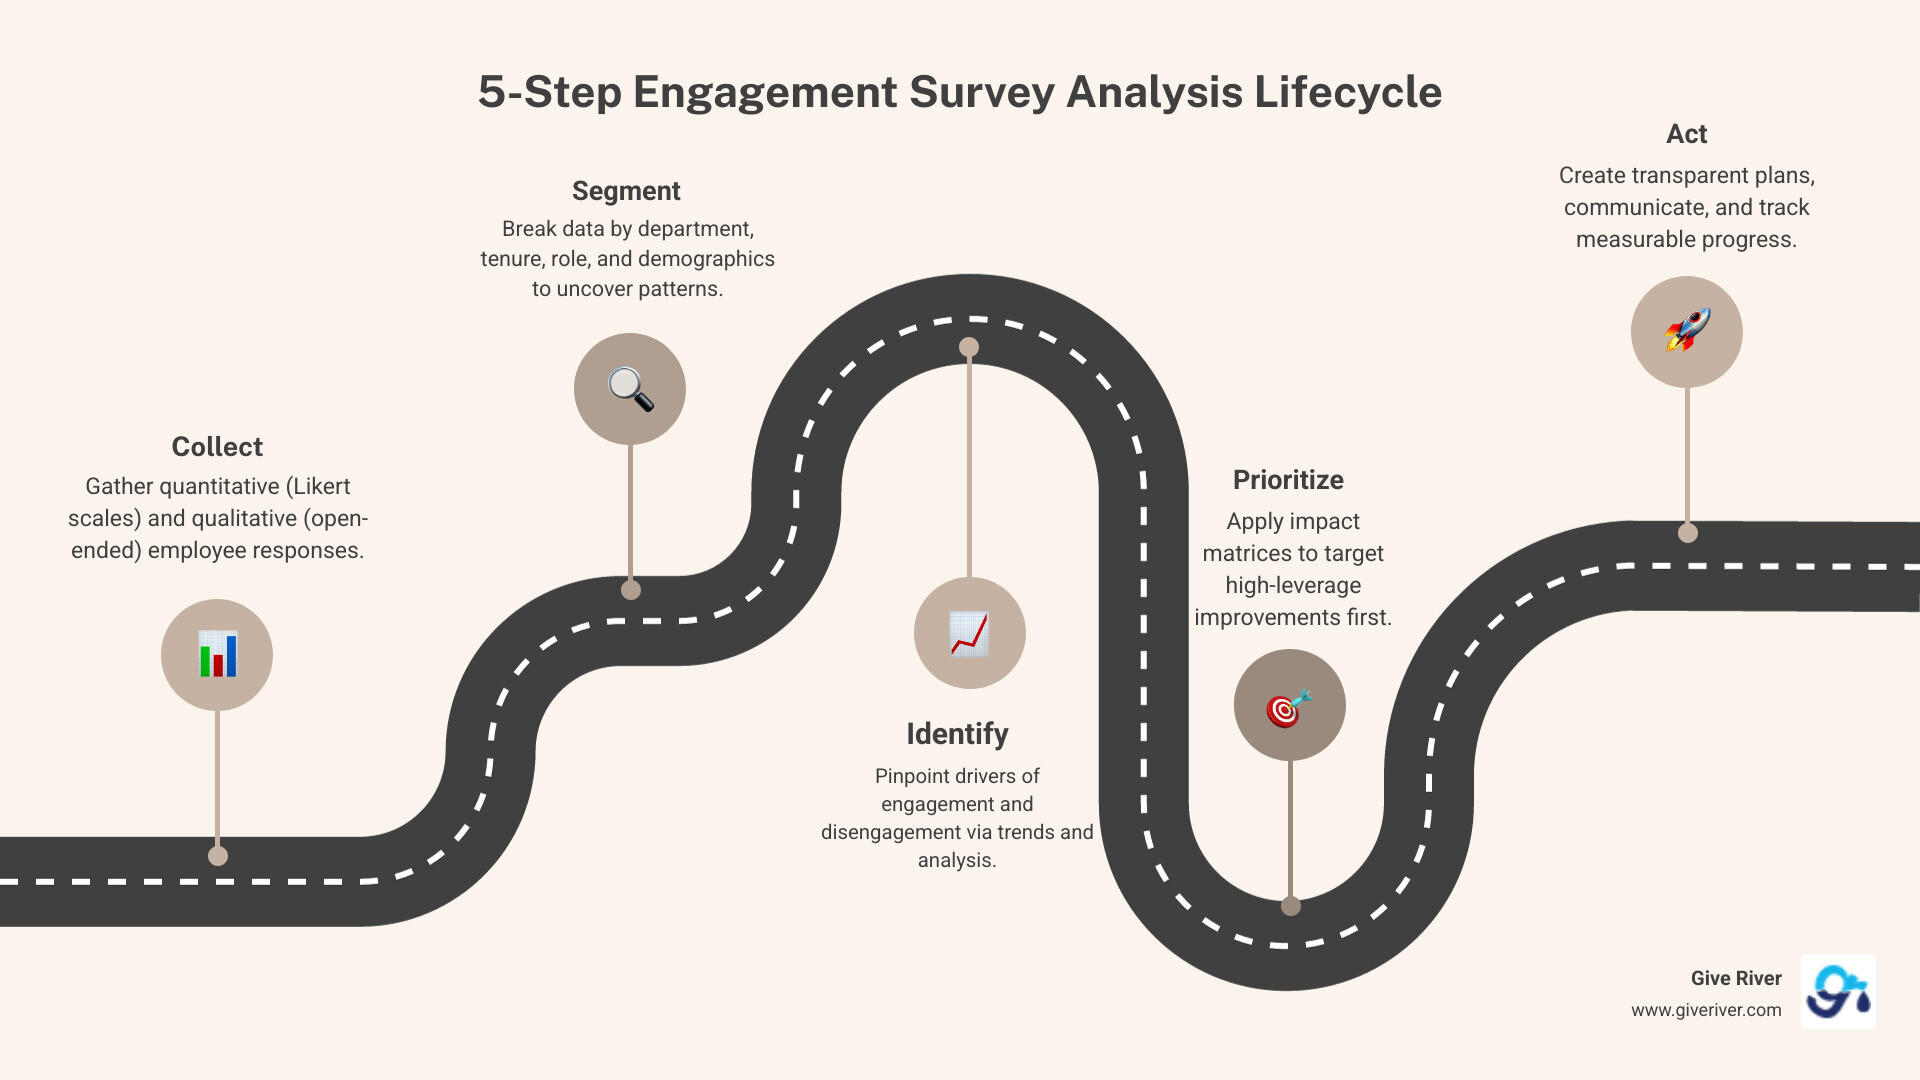
Here's a quick breakdown of what it involves:
- Collect — Gather quantitative (Likert scale) and qualitative (open-ended) responses from employees
- Segment — Break data down by department, tenure, role, and demographics to surface hidden patterns
- Identify — Pinpoint key drivers of engagement and disengagement using trend and driver analysis
- Prioritize — Use frameworks like impact matrices to focus on high-leverage improvements first
- Act — Build a transparent action plan, communicate it to your team, and track progress over time
Most organizations stop at step one. They run the survey, glance at the scores, and file the report away — which is exactly why only 25% of employees believe their organization actually takes effective action based on survey feedback. That gap between collecting data and doing something meaningful with it is where engagement quietly erodes.
The stakes are real. Research consistently links highly engaged teams to 23% higher profitability, 78% less absenteeism, and turnover rates 14.9% lower than organizations that ignore regular feedback. Meanwhile, 63% of workers say they feel their employer has simply tuned them out.
Your survey data isn't the problem. What you do with it is.
I'm Meghan Calhoun, co-founder of Give River and a workplace culture strategist with over two decades of experience leading high-performing teams — experience that taught me how proper engagement survey analysis can transform raw feedback into the kind of fulfillment-driven culture where people genuinely want to show up. In the sections below, I'll walk you through exactly how to crack the code on your employee feedback data, from the numbers all the way through to meaningful, measurable action.
Engagement survey analysis glossary:
Mastering the Essentials of Engagement Survey Analysis
To truly master engagement survey analysis, we first have to understand the tools at our disposal. Not all surveys are created equal, and the way we analyze them depends heavily on the "why" behind the data collection. In April 2026, the landscape of employee listening has evolved beyond the once-a-year "check-the-box" exercise.
We typically look at three main types of surveys to get a full picture of organizational health:
| Survey Type | Frequency | Primary Goal | Analysis Focus |
|---|---|---|---|
| Comprehensive Annual Survey | Once per year | Deep dive into culture and strategy | Longitudinal trends and deep segmentation |
| Pulse Survey | Quarterly or Monthly | Real-time "temperature check" | Immediate impact of recent changes |
| eNPS (Employee Net Promoter Score) | Monthly or Continuous | High-level loyalty measurement | Single-score tracking and "promoter" ratios |
While annual surveys provide the "big picture," pulse surveys allow us to be agile. If we implement a new wellness program in March, we don't want to wait until next year to see if it's working. We need to know now.
One of the most compelling reasons to take this analysis seriously is the bottom line. Statistics show that companies with highly engaged workforces are 24% more profitable. However, achieving that profitability requires statistical validity. We can't make million-dollar business decisions based on a 20% response rate. Generally, a response rate below 60% indicates significant trust issues within the organization, while rates above 80% correlate with much stronger retention and financial performance.
For those just starting out or looking to upgrade their tech stack, choosing the right Employee Satisfaction Survey Tool Guide is a critical first step.
Quantitative vs. Qualitative Engagement Survey Analysis
When we dive into the data, we're dealing with two distinct types of information: the "what" (quantitative) and the "why" (qualitative).
Quantitative data usually comes from Likert scales (e.g., "On a scale of 1-5, how much do you agree..."). This gives us sentiment intensity. It’s easy to graph, easy to compare across departments, and perfect for identifying high-level red flags.
Qualitative data, on the other hand, comes from open-ended questions. While these are harder to "crunch," they are goldmines for insight. In fact, including open-ended survey questions with free response fields can yield higher participation rates by at least 60%. Employees want to explain themselves; they don't just want to be a number.
While platforms like Bonusly or Kudos focus heavily on the "gratitude" aspect of engagement through peer-to-peer recognition, they often function as standalone reward systems. At Give River, we take this a step further by integrating these insights into our 5G Method. Unlike these point-based platforms, Give River bridges the gap between survey feedback and tangible professional growth, ensuring that the "why" behind your data leads directly to community impact and long-term employee fulfillment. To get the best of both worlds, you need to ask the right Employee Survey Questions that balance these two data types.
Segmenting Data for Deeper Insights
If your overall engagement score is 75%, you might feel like celebrating. But engagement survey analysis isn't about averages; it's about outliers.
By segmenting your data, you might find that while your Sales team is at 90%, your Engineering team is at 45%. If you only looked at the average, you’d miss the fact that your developers are halfway out the door. We recommend segmenting by:
- Demographics: Age, gender, and ethnicity can reveal systemic equity issues.
- Tenure: Are new hires excited while veterans are burnt out? Or is it the other way around?
- Departmental Silos: Identifying which managers are crushing it and which need more support.
- Work Location: This is huge in 2026. Data shows remote workers often show higher engagement (29%) than on-site (20%) or hybrid (21%) workers.
Using HR Data Reporting tools allows you to slice and dice this information without spending weeks in Excel. It turns a flat report into a multi-dimensional map of your culture.
Identifying Drivers and Trends in Engagement Survey Analysis
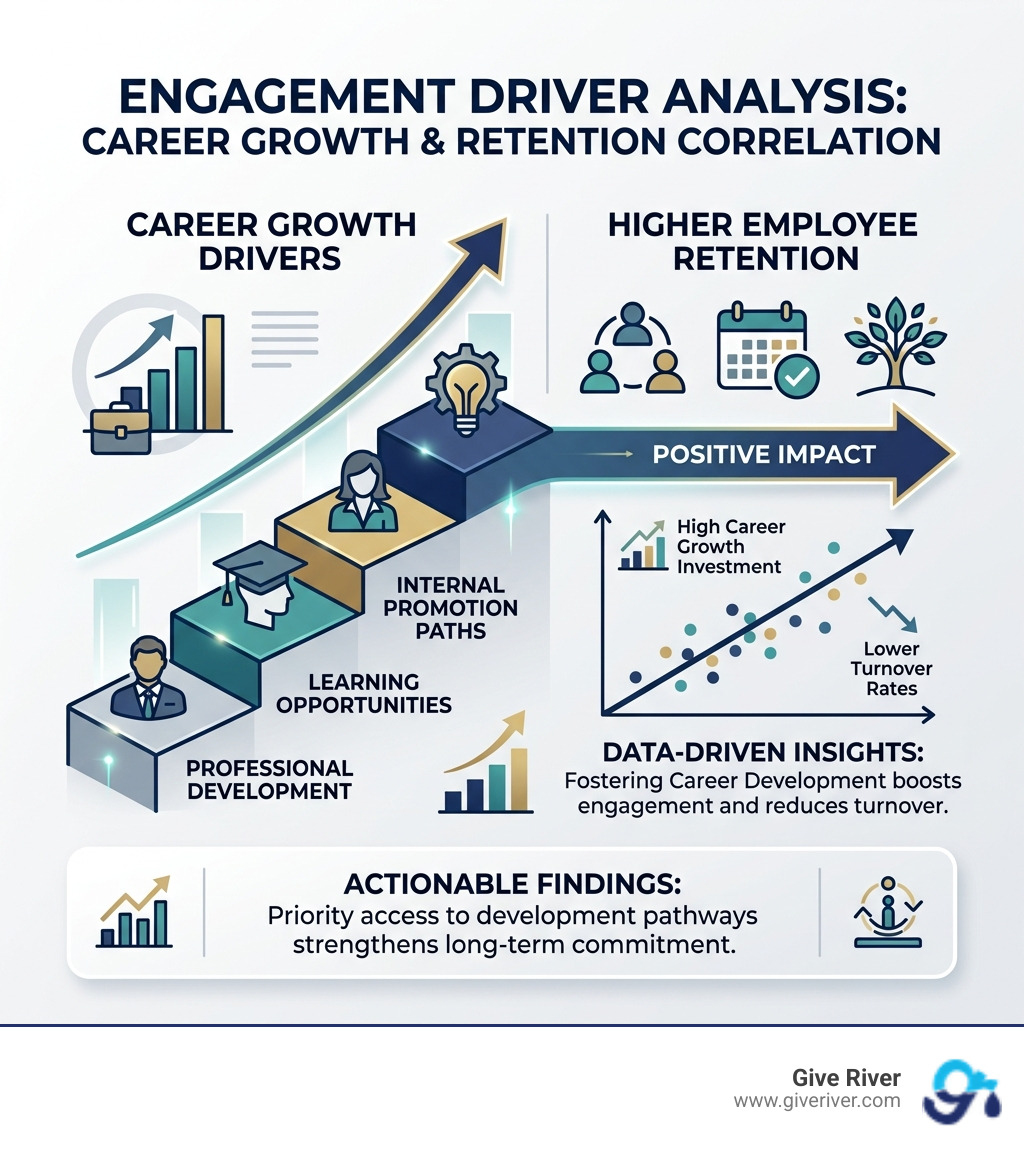
Why are people engaged? Is it the pay? The snacks? The mission? Driver analysis helps us answer this by identifying which factors have the most significant statistical impact on the overall engagement score.
Often, we find that "Career Development" or "Relationship with Manager" are much stronger drivers of engagement than "Compensation." In fact, companies that seek regular employee feedback and act on these drivers see turnover rates 14.9% lower than those that don’t.
We also look at longitudinal studies—tracking the same metrics over months or years. This helps us see if our culture is improving or if we’re just experiencing a temporary "honeymoon phase" after a big bonus rollout. To make sense of your numbers, use external benchmarking. How does your 70% score compare to other companies in your industry? Without context, a number is just a number.
From Data to Action: Implementing Your Findings
The most dangerous thing you can do with an engagement survey is... nothing.
When employees take the time to give honest feedback and see zero changes, they don't just stay disengaged—they become cynical. 100% of award-winning organizations take visible action as a result of their findings.
The transition from data to action requires two things: Leadership buy-in and Manager training. If the C-suite doesn't care about the results, the managers won't either. And if managers aren't trained on how to have "stay interviews" or how to coach their teams based on feedback, the data stays trapped in HR.
Highly engaged teams show 10% higher customer loyalty and 78% less absenteeism. That is a massive operational win that should make every manager eager to participate. Following Employee Engagement Survey Best Practices ensures that your implementation phase is as rigorous as your collection phase.
Developing a High-Impact Action Plan
Once the engagement survey analysis is complete, we need a roadmap. We suggest using a Prioritization Matrix to decide what to tackle first.
- Quick Wins: High impact, low effort (e.g., clarifying a confusing policy).
- Strategic Projects: High impact, high effort (e.g., redesigning the entire career progression framework).
- Fillers: Low impact, low effort (e.g., changing the coffee brand).
- Time Wasters: Low impact, high effort (Avoid these!).
Use Root Cause Analysis to make sure you're fixing the problem, not the symptom. If people say they are "stressed," the solution might not be a yoga app; it might be that they have too many meetings. Set SMART goals (Specific, Measurable, Achievable, Relevant, Time-bound) for your improvements and use an Employee Engagement Tracker to keep everyone accountable.
Communicating Results with Transparency
Transparency is the antidote to the "63% of workers feel ignored" statistic. Even if the results are bad, tell the truth.
- Executive Presentations: Give the leadership the hard numbers and the financial "why."
- Employee Town Halls: Share the high-level themes, thank them for their honesty, and—most importantly—tell them what you are going to do about it.
- Closing the Feedback Loop: "You said [X], so we are doing [Y]." This simple formula builds more trust than any team-building retreat ever could.
For a deeper dive into how to structure these conversations, check out our HR Employee Survey Complete Guide.
Measuring Impact and Avoiding Analysis Biases in Engagement Survey Analysis
Finally, we have to be honest about our own biases. As humans, we are prone to:
- Confirmation Bias: Only looking for data that proves our existing beliefs (e.g., "I knew the Marketing team was unhappy because of their manager!").
- Recency Bias: Over-weighting feedback that happened in the last two weeks while ignoring the rest of the year.
To combat this, we use quarterly pulse checks and validated frameworks like Gallup's Q12. At Give River, our 5G Method (Guided, Gamified, Gratitude, Growth, and Generosity) provides a consistent framework to measure against. By moving away from gut feelings and toward Data-driven insights for workplace culture, we ensure that our analysis is as objective as possible.
Conclusion: The Path to a Thriving Culture
Engagement survey analysis is not a one-time event; it is a continuous cycle of listening, learning, and evolving. In the world of 2026, the organizations that win are those that treat their employees' voices as their most valuable data source.
By moving beyond simple scores and embracing deep segmentation, driver analysis, and transparent action planning, you can transform your workplace from a place where people "have" to work into a place where they "want" to grow.
Ready to turn your data into a competitive advantage? Dive deeper into our Employee Engagement Survey resources or reach out to us at Give River to see how our 5G Method can help you build a high-performing, fulfilled team today.
More from this category.
What Is a Digital Engagement Platform? (And Why It Matters Right Now)
Understanding the digital engagement platform definition starts with a simple idea: it's a technology framework that centralizes how an organization communicates with, supports, and motivates its people — employees or customers — across…

Understanding Gamification in the Workplace
Employee disengagement is a significant concern for many organizations today, impacting productivity and morale. Employee engagement through gamification offers an innovative solution by changing mundane tasks into exciting experiences. By…

Why Most Managers Are Flying Blind on Team Engagement
The best employee engagement tools for managers in 2025 include:
See the platform in action.
30-day free trial. No credit card. River Guide included on Core and Growth.